Posting Inquiry
 »
» 
Overview
The Posting Inquiry program allows you to view Invoices, Credit Notes and Cost Only postings generated from source Documents in Service Manager.
A Document can have multiple postings within it to allow for partial billing, backorder shipments, held items or services, or various other issues.
Starting the Posting Inquiry Program
Click the Posting Inquiry desktop icon.

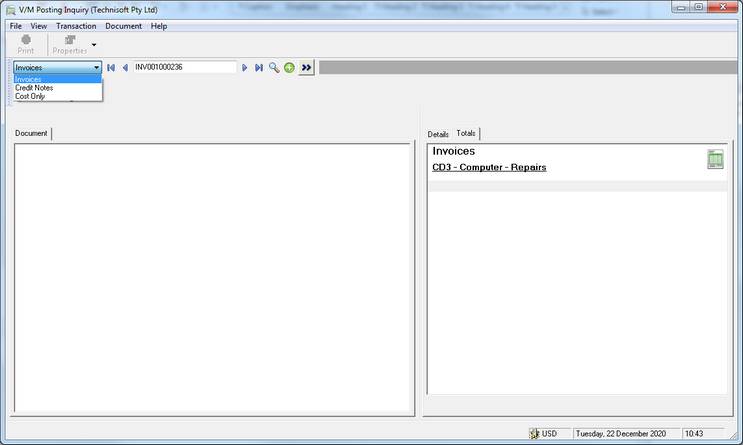
The Posting Inquiry window will be displayed.
Finding a Document
Use the drop-down list to select the type of document to be searched for.

Once the document type is selected, you may navigate through relevant documents using the navigation bar. You can go to the first or last record by using the extreme left or right arrows, or navigate through the documents one at a time using the left and right arrows. You can also use the up and down arrows, Ctrl+Home and Ctrl+End keyboard keys to navigate through the records.
![]()
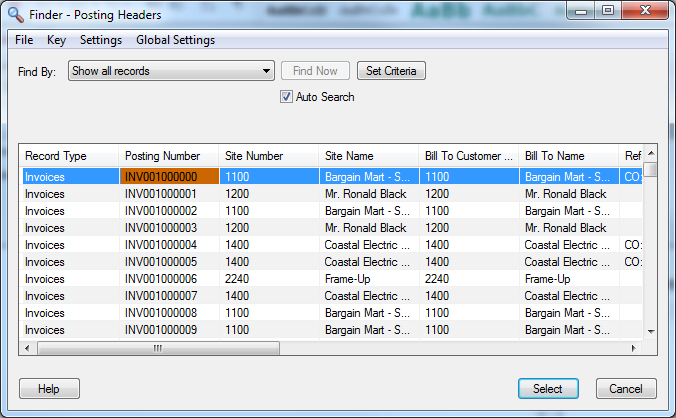
Use the Finder![]() for a more comprehensive search to find the document you wish to query.
for a more comprehensive search to find the document you wish to query.
Once a document has been selected, click Go ![]() to retrieve the details into the document tree.
to retrieve the details into the document tree.
Displaying the Document
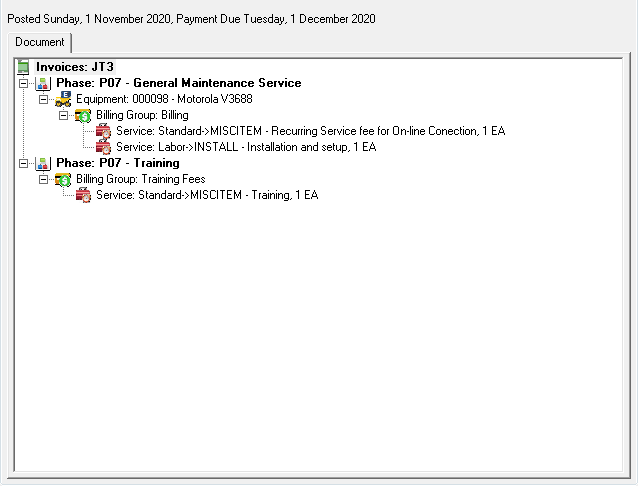
Document tree
The Document tree is opened with all nodes expanded.
Details tab
The Details tab in the right-hand pane displays information about the selected node in the Document tree.
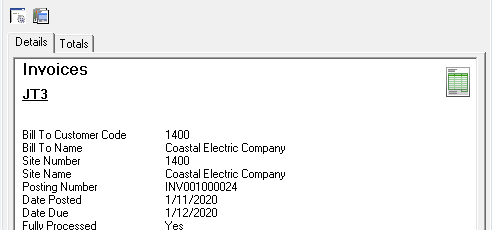
To customize the display on the Details tab, select Transaction » Options and select the field to be displayed.
Totals tab
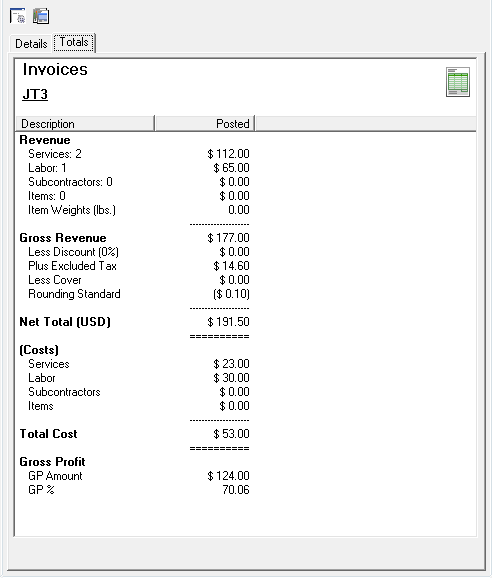
The Totals tab in the right-hand pane displays Posted totals for the currently selected node - Document, Phase, Billing Group, Service, Item, etc.
Consolidated Invoices
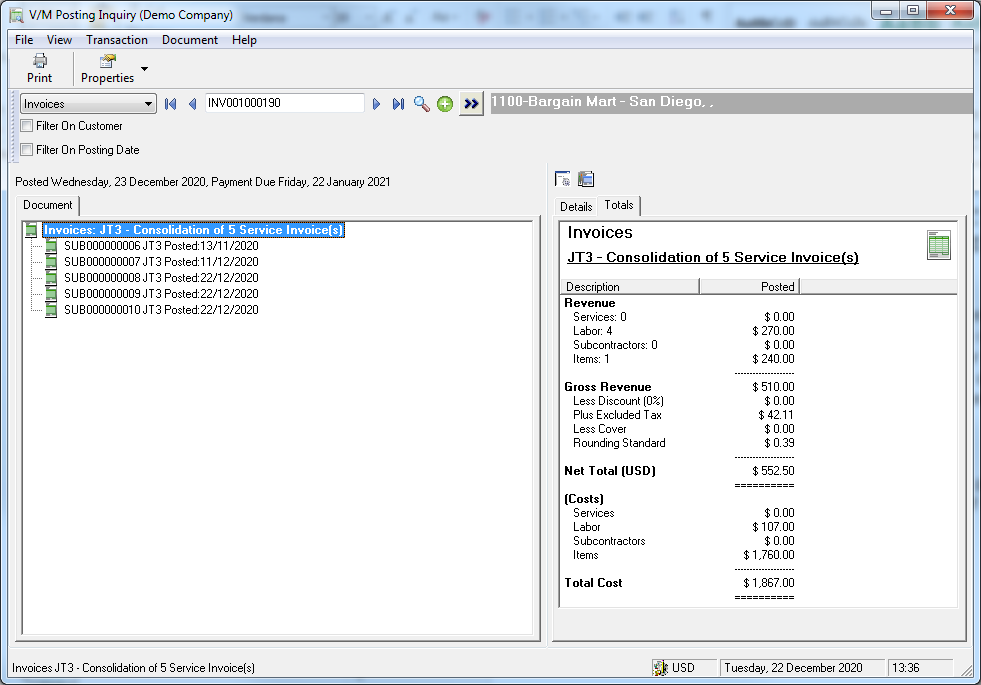
The Posting Inquiry Document Tab displays the individual Sub Invoices of a Consolidated Invoice under the Header.
All Sub Invoice values are calculated and shows them as Totals on the Totals Tab.
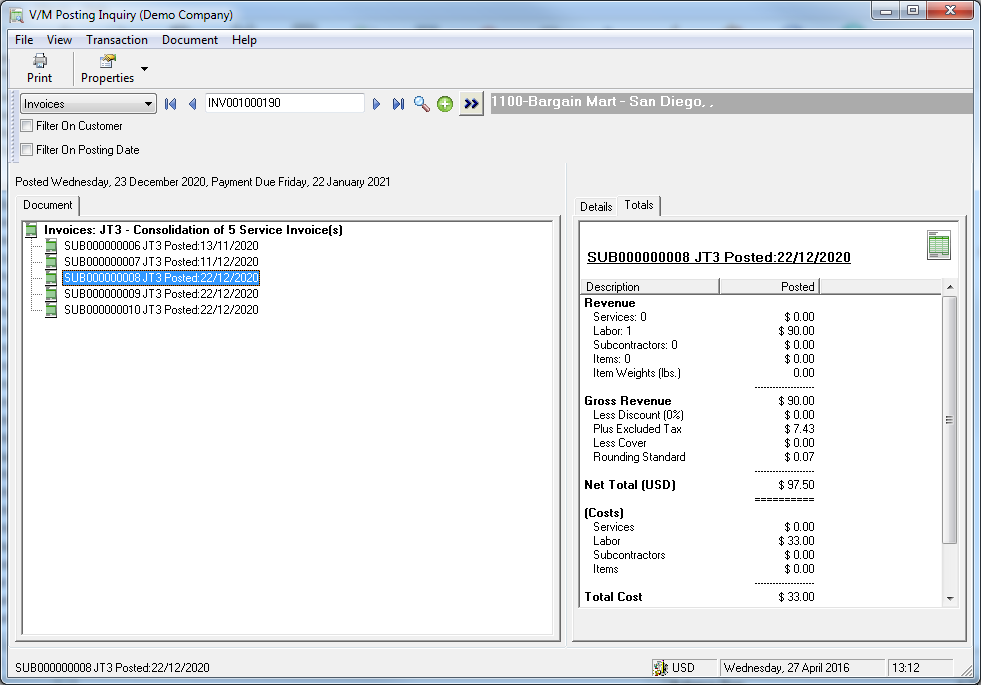
When a Sub Invoice line is selected, the highlighted Sub Invoice's totals will display on the Totals Tab.
Posting Inquiry – Setting Visibility in Customer Portal
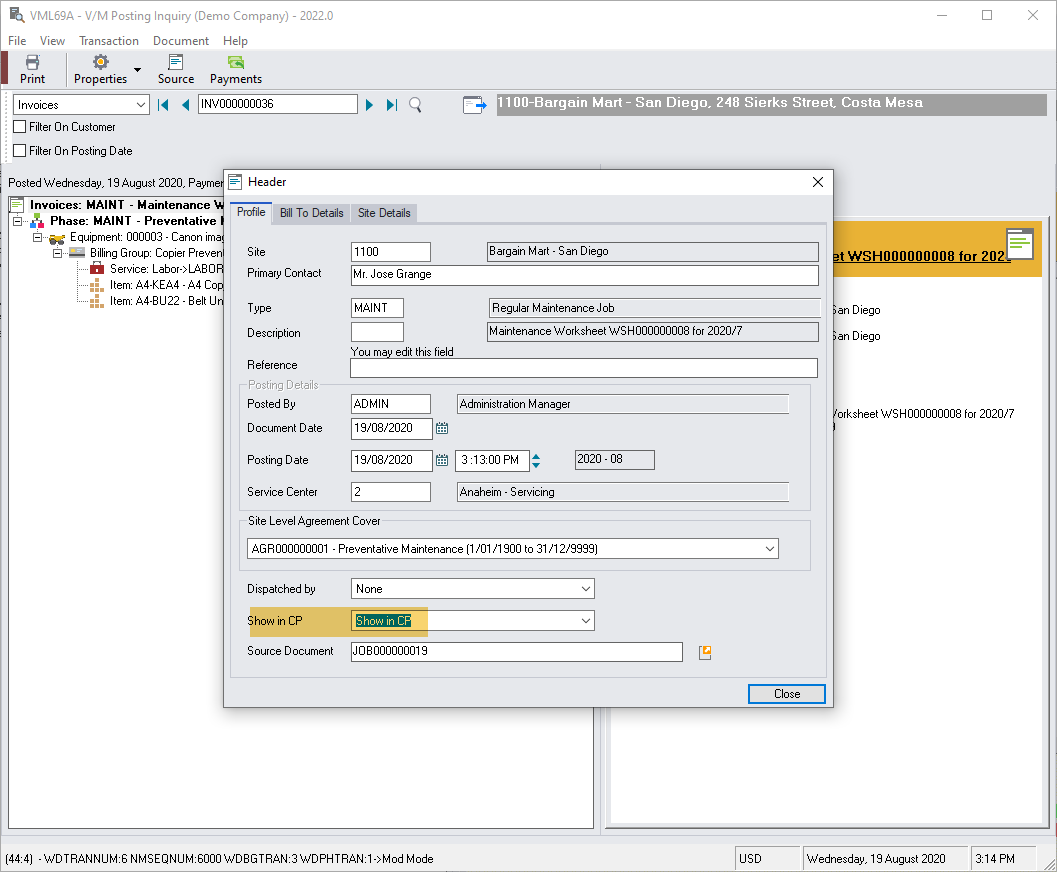
Any posting (invoice/credit etc.) generated from a document, will inherit the source documents Customer Portal publish option.
However, each posting can be independently set to Show or Hide the invoice from the Customer Portal.
Open the Invoice in Posting Inquiry and select the Header, select the Profile tab, set the “Show in CP” option as required.
Additional functions
You can view Custom Fields, Graphics and History using the icons that appear at the top of the right-hand pane.
![]()
The icons available depend on the node selected.

