Maintenance Calendar Graphs

Contents
 »
»  »
» ![]()
Graphs are available showing:
•Estimated and Actual Duration by month or period
•Estimated and Actual Utilization by month or period
•Predicted and Actual Task Counts by month or period
•Estimated and Posted Revenue by month or period
•Predicted and Actual Site Count by month or period
•Predicted and Actual Equipment Count by month or period.
Click Graph to display the graphs. The Maintenance Calendar Graph window will be displayed.
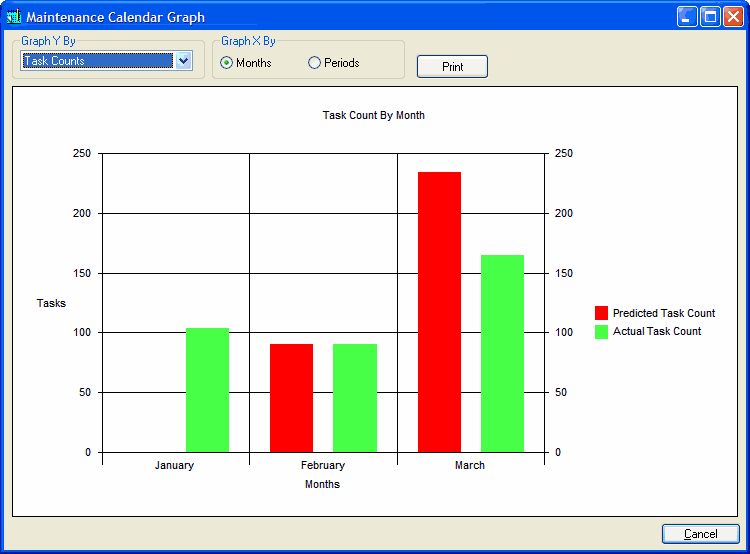
Select the graph to be displayed.
Click [Print] to print the graph.