Financial Distribution Statistics

Contents
 »
» 
Overview
Financial Statistics, or more correctly termed, Financial Distribution Statistics, are generated by Day End Processing and include Counts, Revenue, Cost, Gross Profit and performance indicators.
Statistics are maintained for many of the Setup records. These include: Sites, Equipment, Models, Class Types, Job Types, Employees, Work Groups, Phases, Services and Marketing Information such as Market, Sector, Industry, Channel and Profile.
Statistics are recorded by Year and Period.
The Program allows you to view this information in several formats based on Revenue, Cost or Gross Profit calculations.
It also presents totals for each group you choose to be displayed.
This is a wonderful tool to compare accounting information across year and/or periods for Sites, Employees, Models, Equipment and any other statistics tracked by this program.
A key financial indicator in this program is Proportion Analysis. For instance, you can determine what percent of your business each Customer has contributed as a proportion of your total business. This is useful for analyzing sales distribution according to the 80/20 rule, for example.
Running Financial Statistics
Click the Financial Statistics desktop icon.
The Statistics window will be displayed.
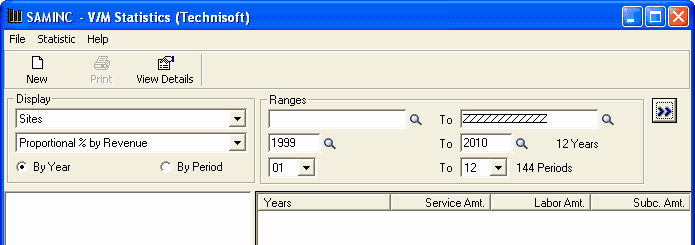
Specifying Statistic Criteria
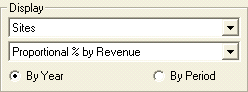
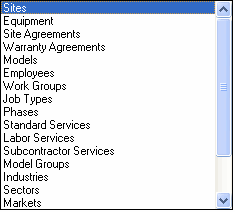
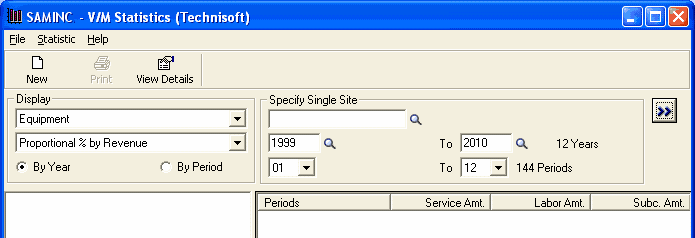
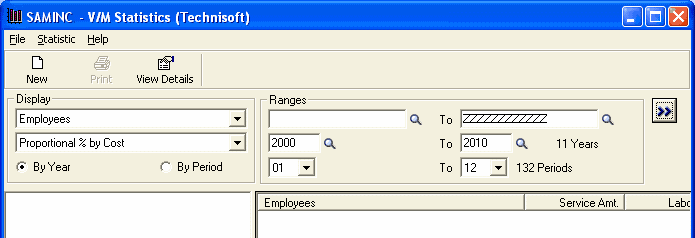
Select the type of Statistics required.
![]()
The example shown will create Site statistics by % Proportion of Revenue.
Select the range of Sites and Dates required and then click Go ![]() .
.
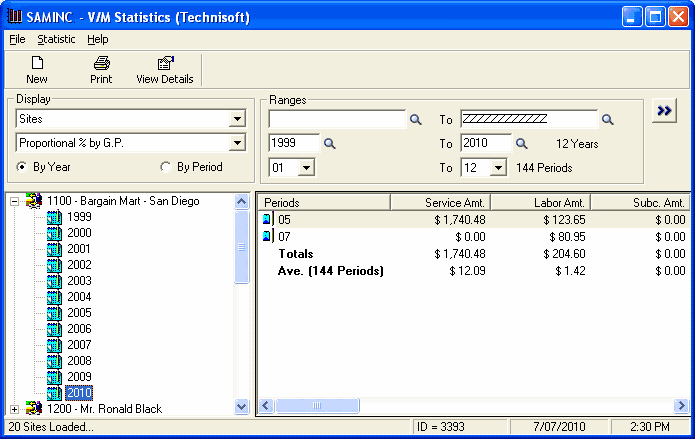
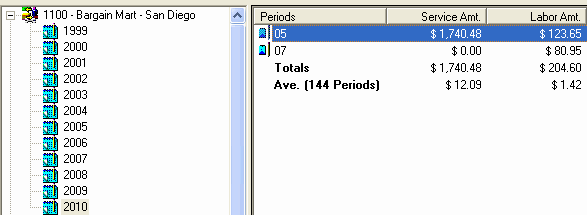
Site Statistics
The tree structure opens to display the period information. It is possible to view all these statistics by individual period through to entire company history, as chosen in this example. The totals will be displayed from your choice of view.
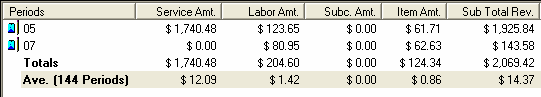
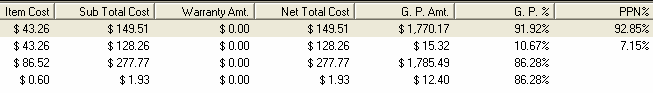
The following three pictures detail the column headers as displayed when the horizontal scroll bar is moved to the right.
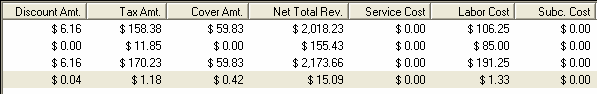
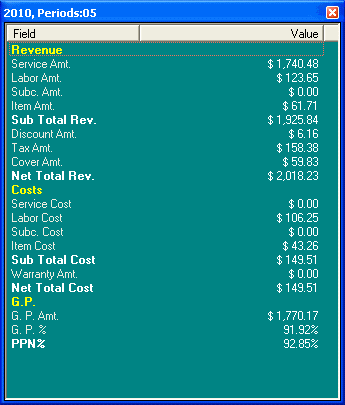
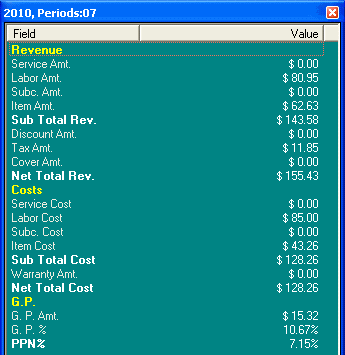
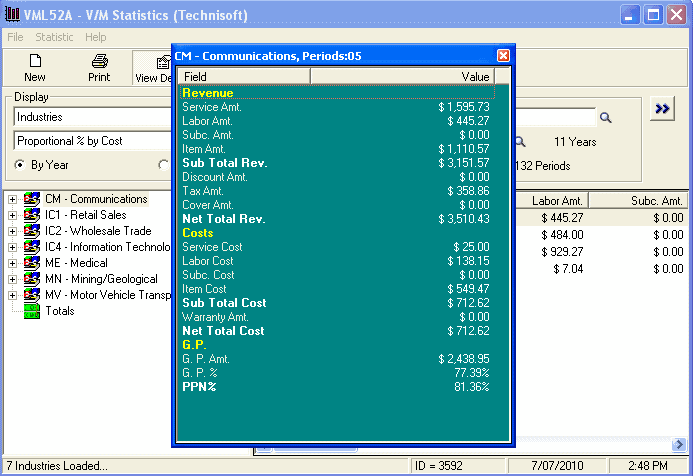
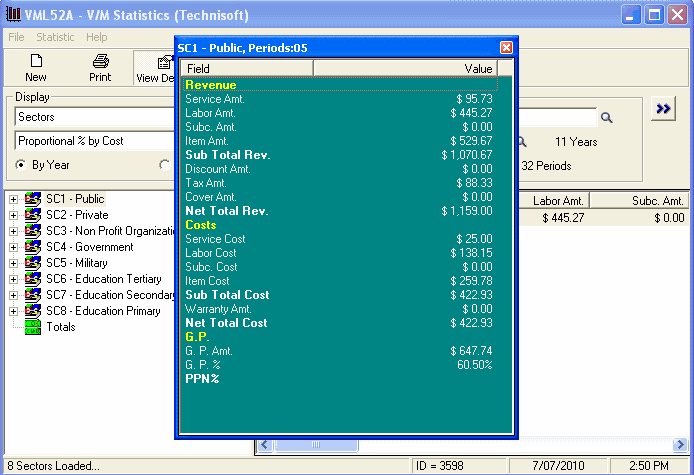
At any time, you are able to click on a selected client, select the year to examine and the period information will appear. You are now able to double-click on the periods in the right pane and a summary window will open displaying the totals.
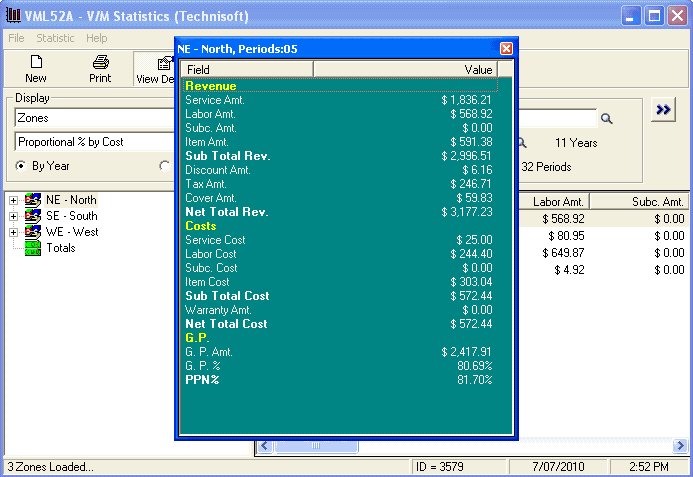
This is the summary window for the year 2010 and the period 05.
This is the summary window for the year 2010 totals.
Equipment Statistics
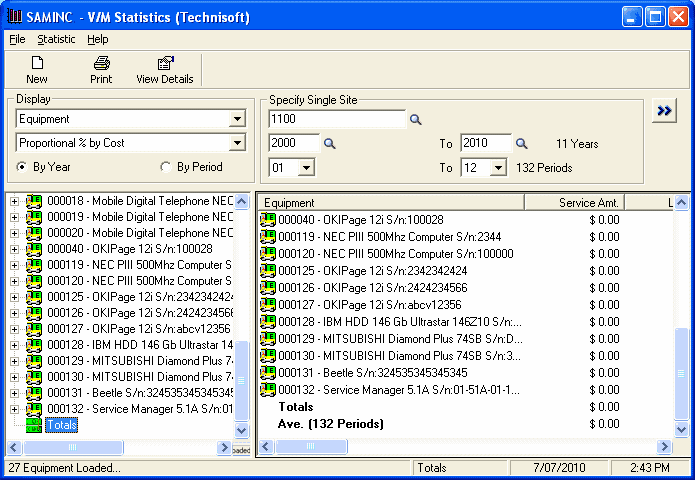
By selecting Equipment from the Display drop-down list, you can specify a date, period and year ranges. If you were to select all Equipment for a range, you could analyze financial data for a month or the entire life cycle of any piece of Equipment.
Click Go ![]() to refresh the screen.
to refresh the screen.
We can now select any Equipment listed and analyze its financial statistics over the selected time frame. Setting the search criteria to Year 2010 and Period 7 will display the financial statistics only for that period.
Click the View Details icon on the toolbar to display the lines detail in a window box form that is easier to read.
You can maximize the screen to view larger data sets. When the totals are selected you will view overall financial statistics for the entire equipment range associated with that site.
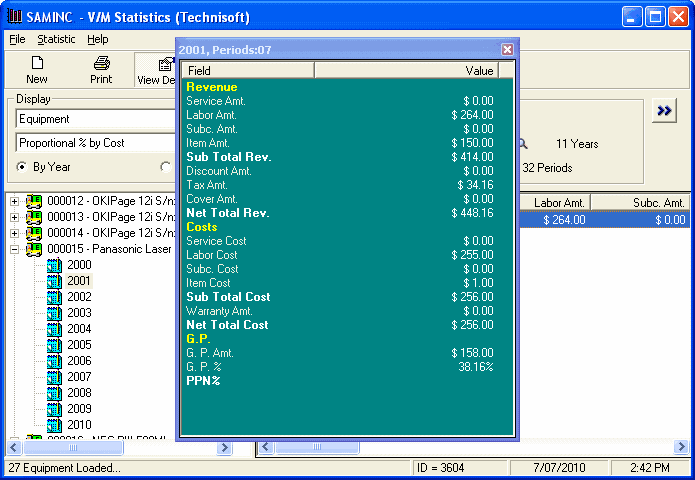
You can maximize the screen to view larger data sets. When the totals are selected you will overall financial statistics for the entire equipment range associated with that site.
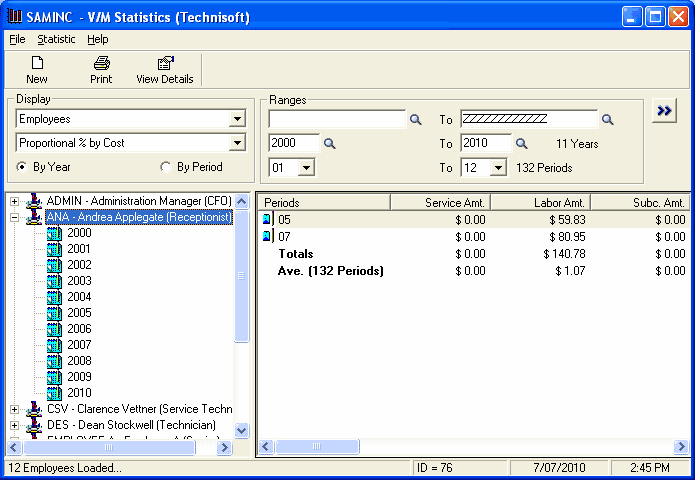
Employee Statistics
By selecting Employees from the Display drop-down list, you can specify a date, period and year range. If you were to select all employees for a range, you could analyze financial data for a month or the entire financial history of any employee.
Click Go ![]() to refresh the screen.
to refresh the screen.
We can now select any Employee and analyze the financial statistics for that Employee over the time frame selected.
Industry Statistics
We can select Industries from the Display drop-down list.
Click Go ![]() to refresh the screen.
to refresh the screen.
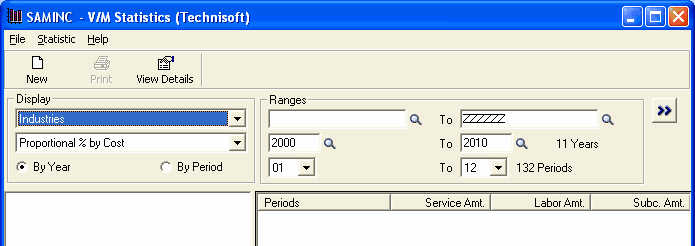
This will display the selected Industries. The Industry breakdown is also a useful tool to decide which market is performing better, where to focus your mainstream of business, where to invest more resources, etc.
Sector Statistics
Select Sectors from the Display drop-down list to find out which market sector is performing better than others.
Click Go ![]() to refresh the screen.
to refresh the screen.
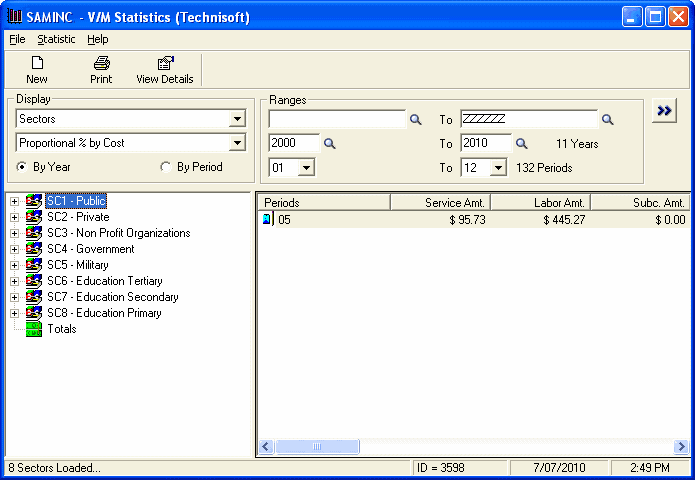
View Details will display totals for that line.
Zone Statistics
Select Display » Zones to view financial statistics divided up by zones.
Click Go ![]() to refresh the screen.
to refresh the screen.
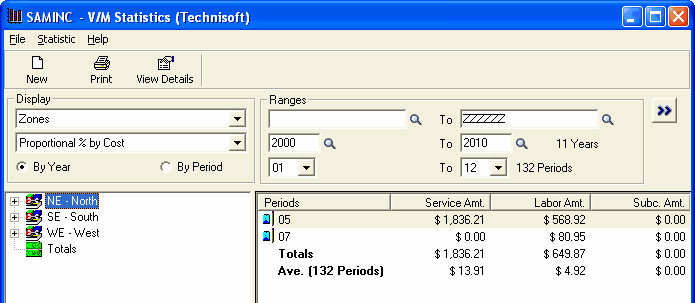
View Details on any line will display the totals for that line.