Home

Contents
The Home screen is displayed when you first log in or when you click the Home button.
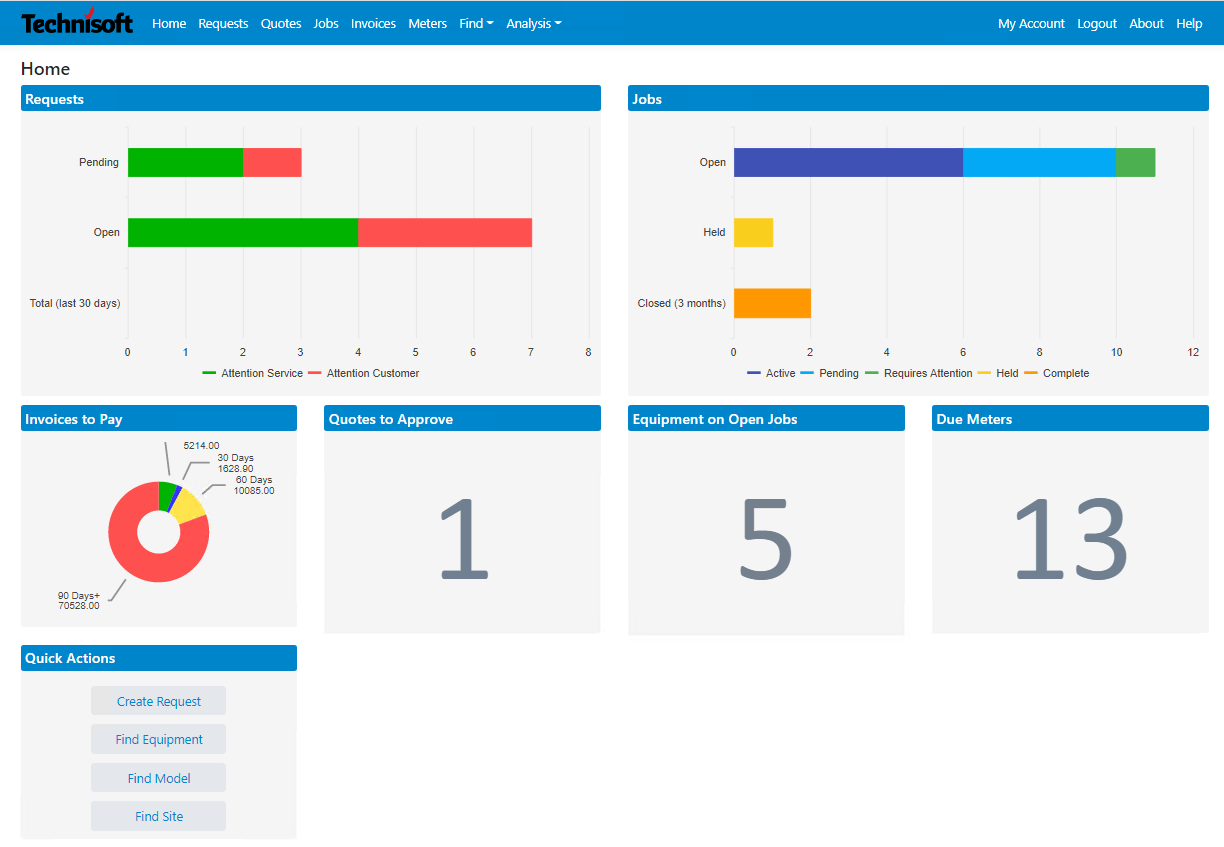
The Home screen shows a dashboard style display to visually track, analyze and identify key points.
Requests
The Requests chart shows a count of the number of Pending and Open Requests as well as Total Requests entered within the last 30 days. These counts are grouped by the workflow indicators of Attention Service or Attention Customer.
Hovering over the group will raise a tooltip to display the group count for each status. Drill in to the Request screen by clicking anywhere in the Requests chart which will filter the results list by hiding closed and canceled Requests.
Jobs
The Jobs chart shows a count of the number of Open and Held Jobs as well as a count of Closed Jobs.
Drill in to the Jobs screen by clicking anywhere within the Jobs chart.
Invoices to Pay
Invoices with a balance due are shown in the Invoices to Pay doughnut chart. Balances are grouped by due date.
Drill in to the Invoices List by clicking anywhere within the Invoices to Pay chart which will filter the results list to Outstanding Invoices only.
Quotes to Approve
The number of Quotes to Approve is displayed as a count on the tile. Click to drill in to the Quotes list which will filter the results for those which have not been Approved.
Equipment on Open Jobs
The number of Equipment records on Open Jobs is displayed as a count on the tile. Click to drill in to the Equipment list which will filter the results for those which are on an Open Job.
Due Meters
The number of Meters due for reading is displayed as a count on the tile. Click to drill in to the Meters list which will filter the results for those which are due.
Quick Actions
Shortcut links to popular screens are displayed in the Quick Actions tile. Create Request, Find Equipment, Find Model and Find Site.